By the Numbers
You might think diving ("flopping" if you're American) is too slippery to measure — a matter of opinion, an eye-of-the-beholder thing. It isn't. Researchers have sat down with match footage and counted the theatrics. Timed them. Classified them. Cross-referenced them against fouls, cards, scorelines, and stretchers. The result is a body of peer-reviewed literature that says, with p-values attached: most of what hits the grass is not injured.
Source: Rosenbaum et al., International Journal of Sports Medicine, 2010 — 89 group-stage matches across four international tournaments, 980 apparent injuries logged.
Statistical Fingerprints
Here's the elegant part. Real injuries and fake ones leave different statistical fingerprints, and Rosenbaum's team found both. Questionable injuries tracked the things that make diving useful: they clustered around fouls (P<0.001), yellow cards (P=0.013), and the first half (P=0.001), with another spike in the final third of the second half (P=0.039) — precisely when a stoppage is worth the most. Definite injuries tracked the things you can't fake: on-field medical treatment and stretchers (P<0.001). Actual pain follows physics. Performed pain follows the scoreboard.
A 2022 study went deeper into the anatomy of the injury stoppage itself. Dönmez et al. reviewed 266 matches in a top professional league and logged 893 injury time-outs — about 3.4 per match, averaging 88.7 seconds each. Of all the players who went down and received treatment, only 17.4% were actually unable to finish the match. And the tactical tell is right there in the data: teams in the lead had significantly more injury stoppages than teams that were losing (P<0.05). Winning, it turns out, is a leading cause of injury.
The Enforcement Gap
In 2011, researchers at the University of Queensland studied diving as an evolutionary biology problem: deception in humans, with referees as the "receivers" who are supposed to detect it. David et al. analyzed 60 televised matches — ten each from six top professional leagues — and classified every single fall.
Read that last card again. Across 60 professional matches, diving carried a one-in-three chance of a reward and a zero-in-169 chance of a consequence. The study also found dives were about twice as frequent near the attacking goal, more common when the score was level — and roughly three times more likely to be rewarded when the fall happened close to the referee. Players aren't just diving; they're diving strategically, and it's working.
A Control Group Exists
Rosenbaum's team ran the same protocol on 47 televised matches from two international women's tournaments. Comparing like with like — apparent injuries per game, both teams combined — men's matches produced 11.26 apparent injuries per game; women's produced 5.74. Roughly half. And when women did go down, it was nearly twice as likely to be real: 13.7% of women's apparent injuries were definite, versus 7.2% in the men's game.
Source: Rosenbaum et al., Research in Sports Medicine, 2011. At the 2007 Women's World Cup, team physicians reported 2.3 actual injuries per match while observers logged about 6 apparent ones — so the women's game isn't clean, just half as dirty.
One last pillar, because it demolishes the favorite excuse — "you can never really know." Morris & Lewis (2010), in the Journal of Nonverbal Behavior, showed that deceptive falls carry distinct, observable physical signatures. Divers move in ways genuinely fouled players don't, and the paper catalogs the tells. Observers reliably identified deceptive falls; in the authors' words, deceptive intentions "are to a degree manifest in behavior and are observable." A dive is not a matter of opinion. It's a matter of body mechanics — visible in real time to trained observers, and trivially visible on replay. Which raises an obvious question: if science can spot a dive, why can't football?
Original Analysis
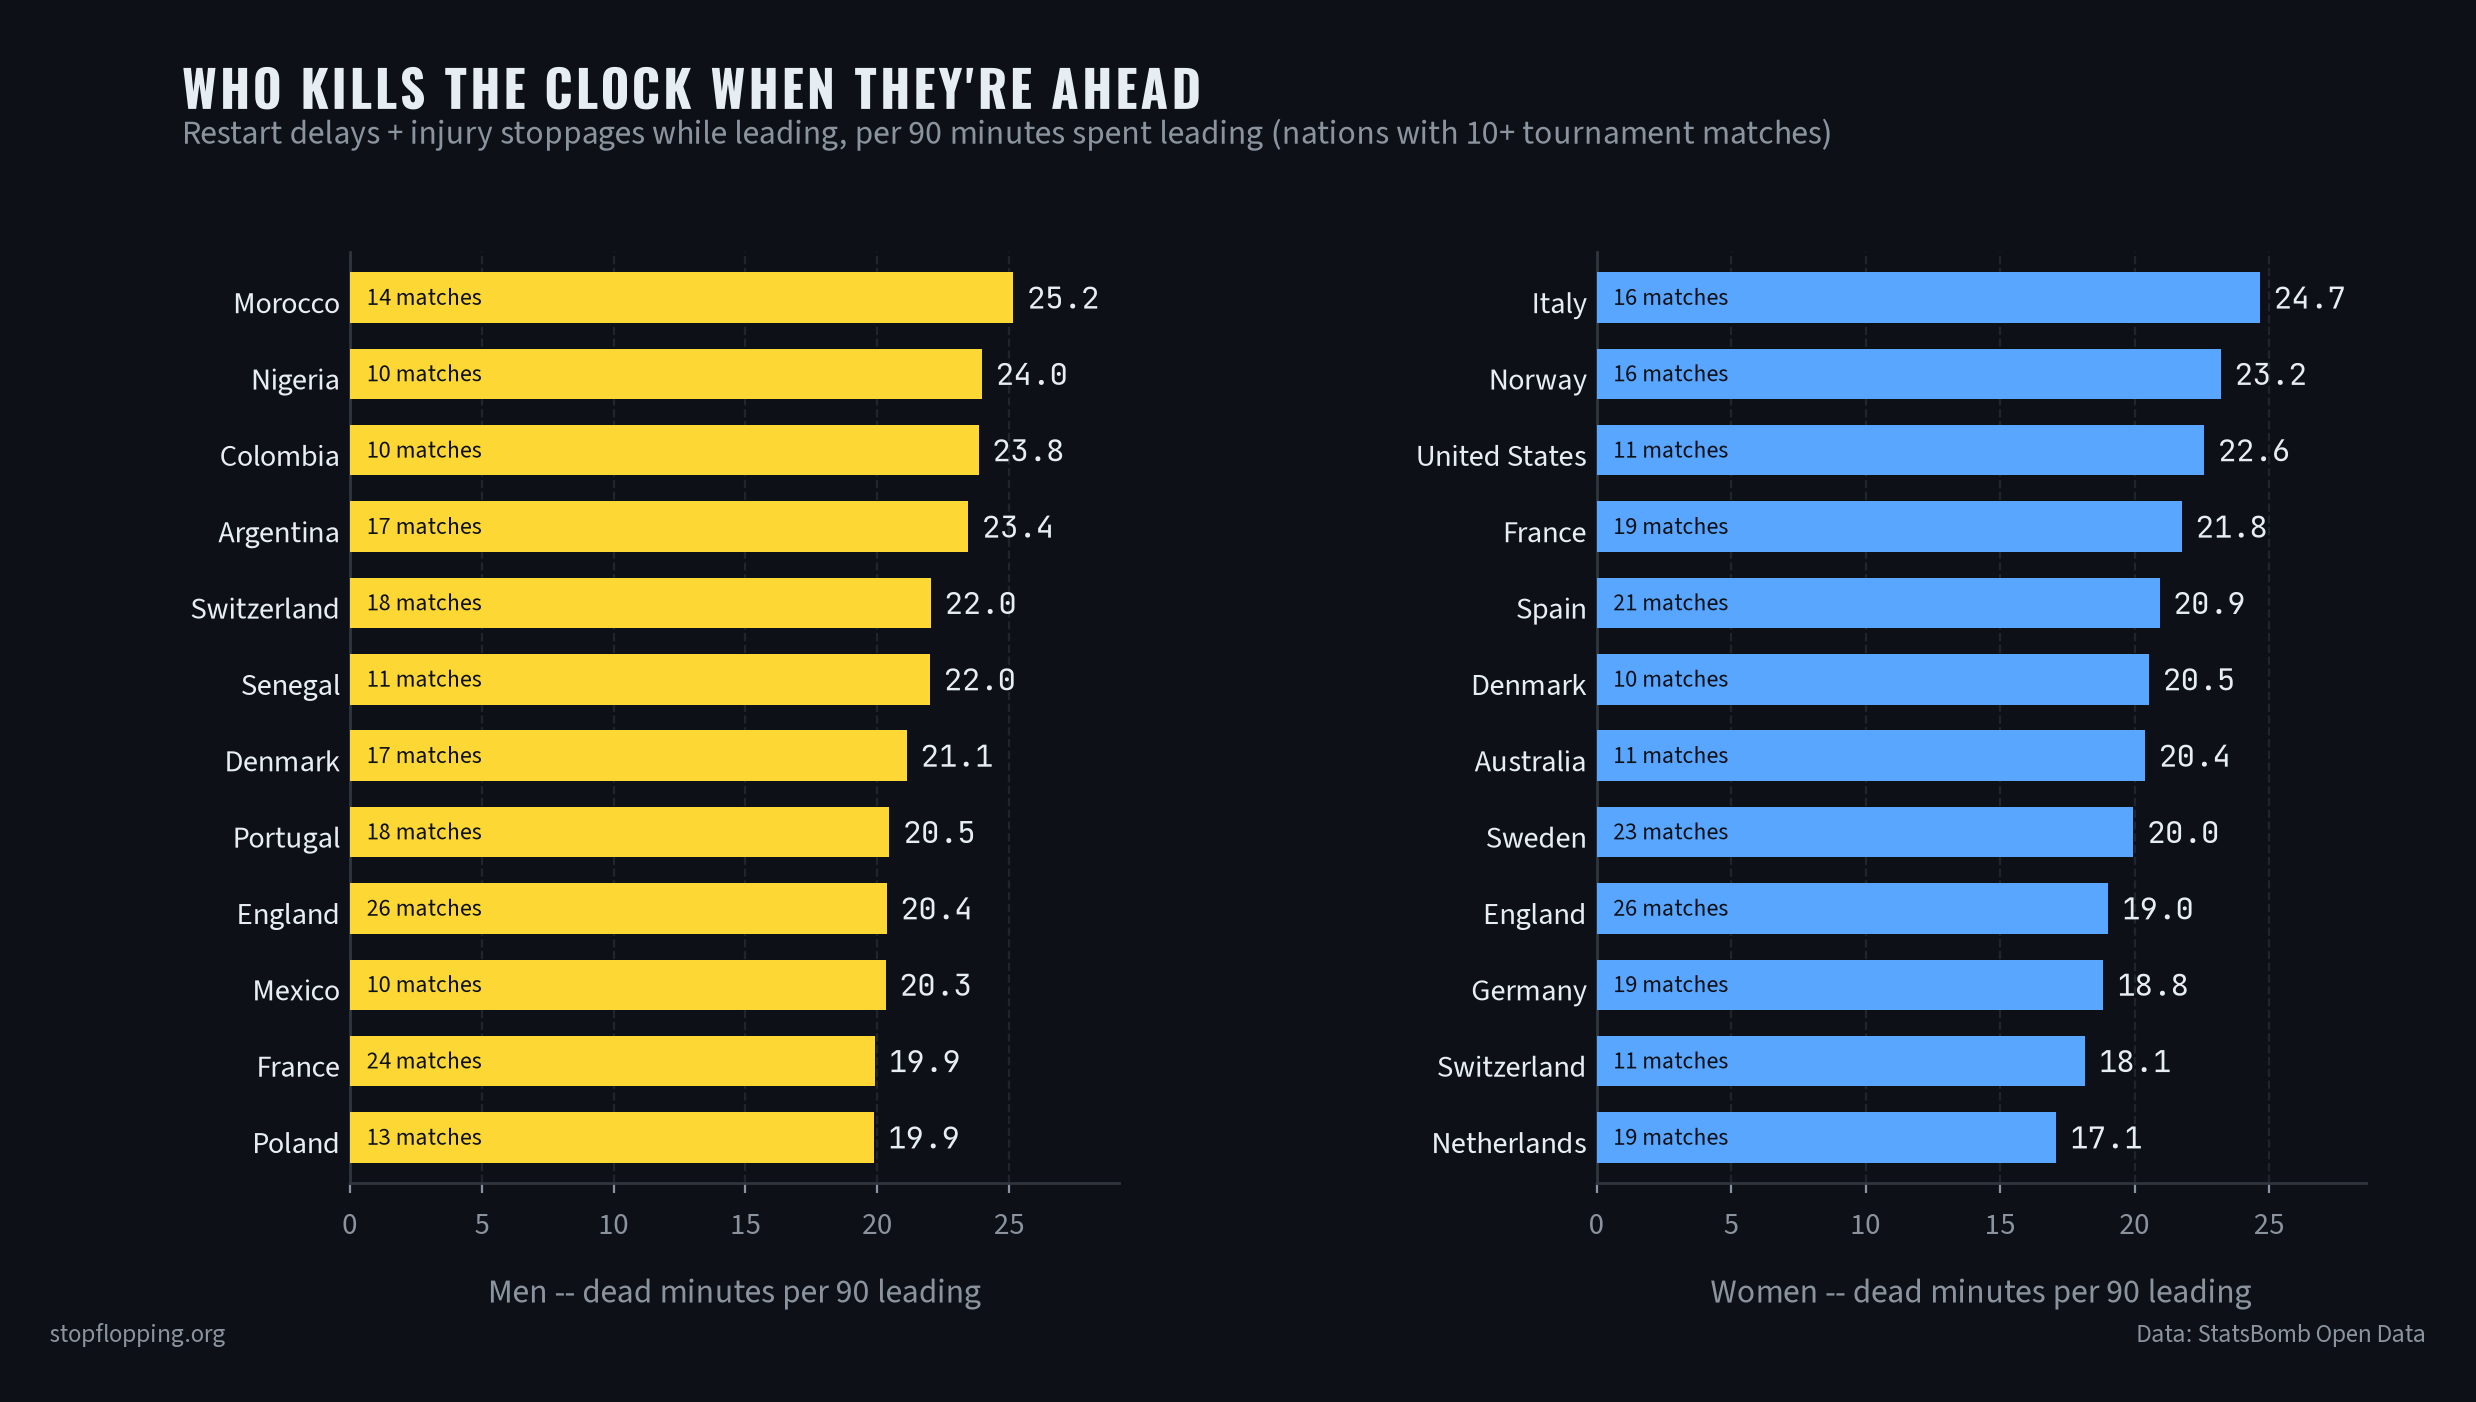
"Is this even a real problem?" Fair question — so we measured it ourselves. We ran StatsBomb's public event data for 492 international tournament matches (men's World Cups 2018 & 2022, Euros 2020 & 2024, Copa América 2024, AFCON 2023; Women's World Cups 2019 & 2023, Women's Euros 2022 & 2025) and timed every injury stoppage and every restart delay, attributed to the team that controlled it. If going down were random misfortune, the results would look like noise. They look like a strategy.
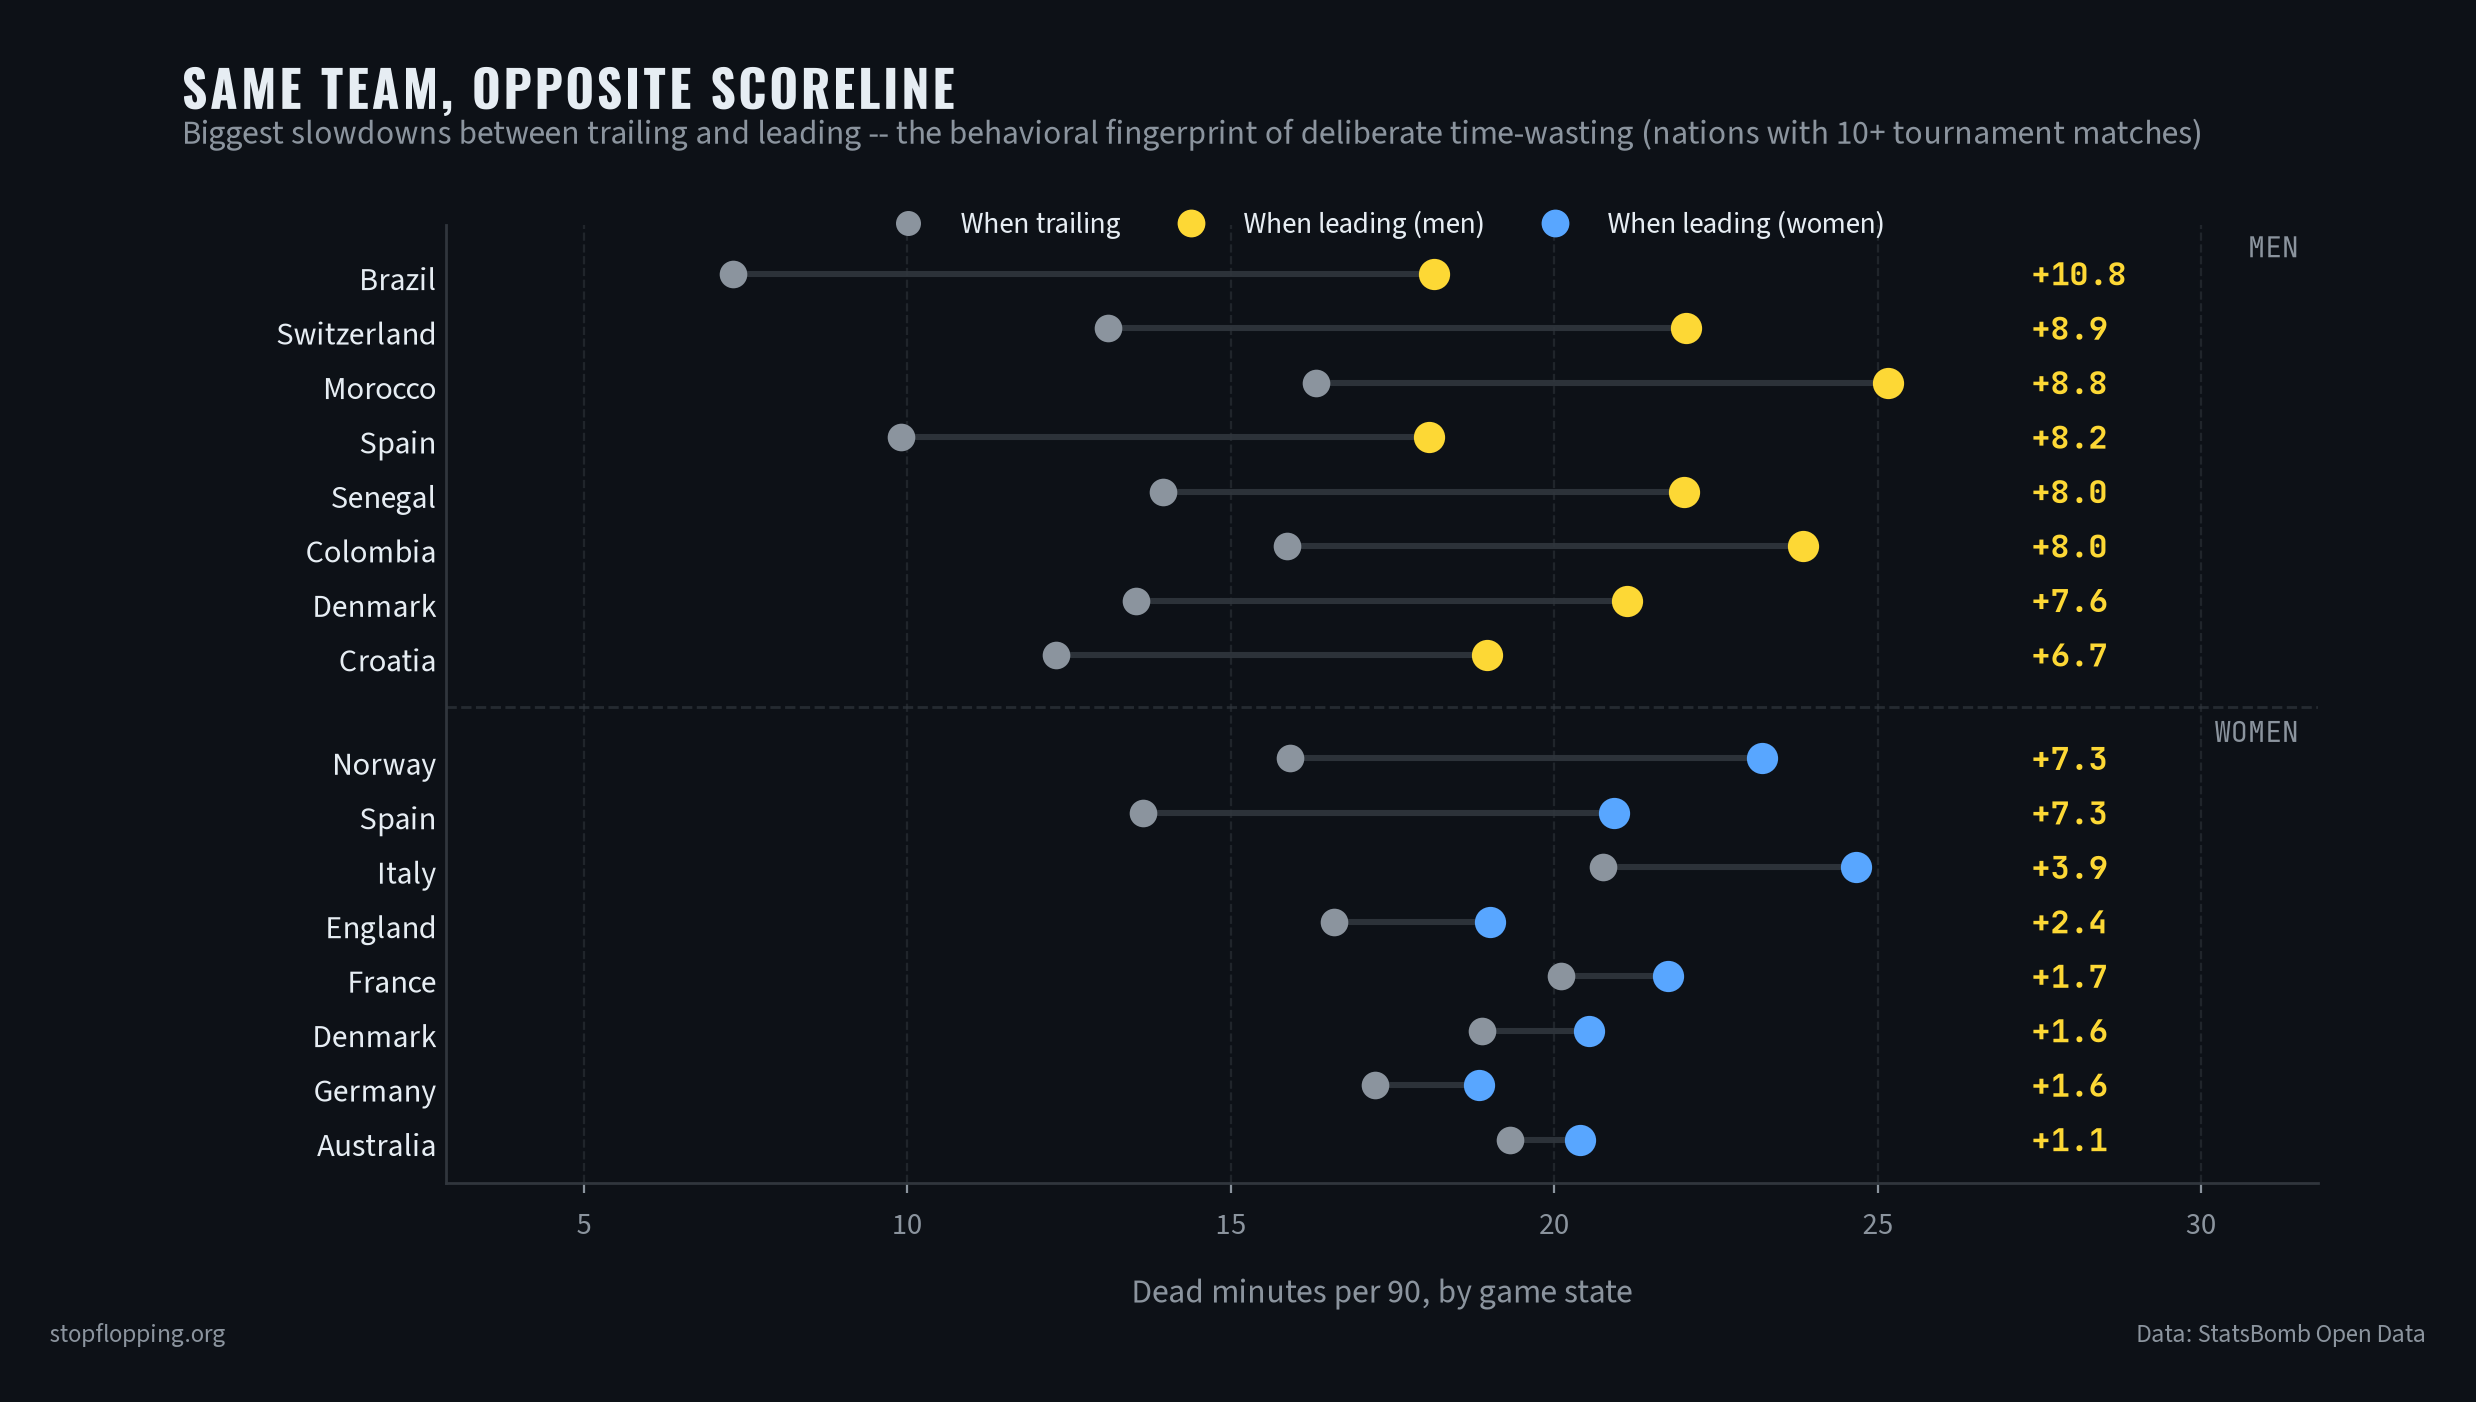
The killer detail isn't the ranking — it's the same team on opposite scorelines. Brazil are the fastest team in the entire dataset when they're losing (7.3 dead minutes per 90) and nearly triple that when they're winning (18.2). Switzerland slow down by +8.9 minutes, Morocco +8.8, Spain +8.2. Nothing about football physically changes when the scoreboard flips — only the incentive does. That's not congestion. That's a choice.
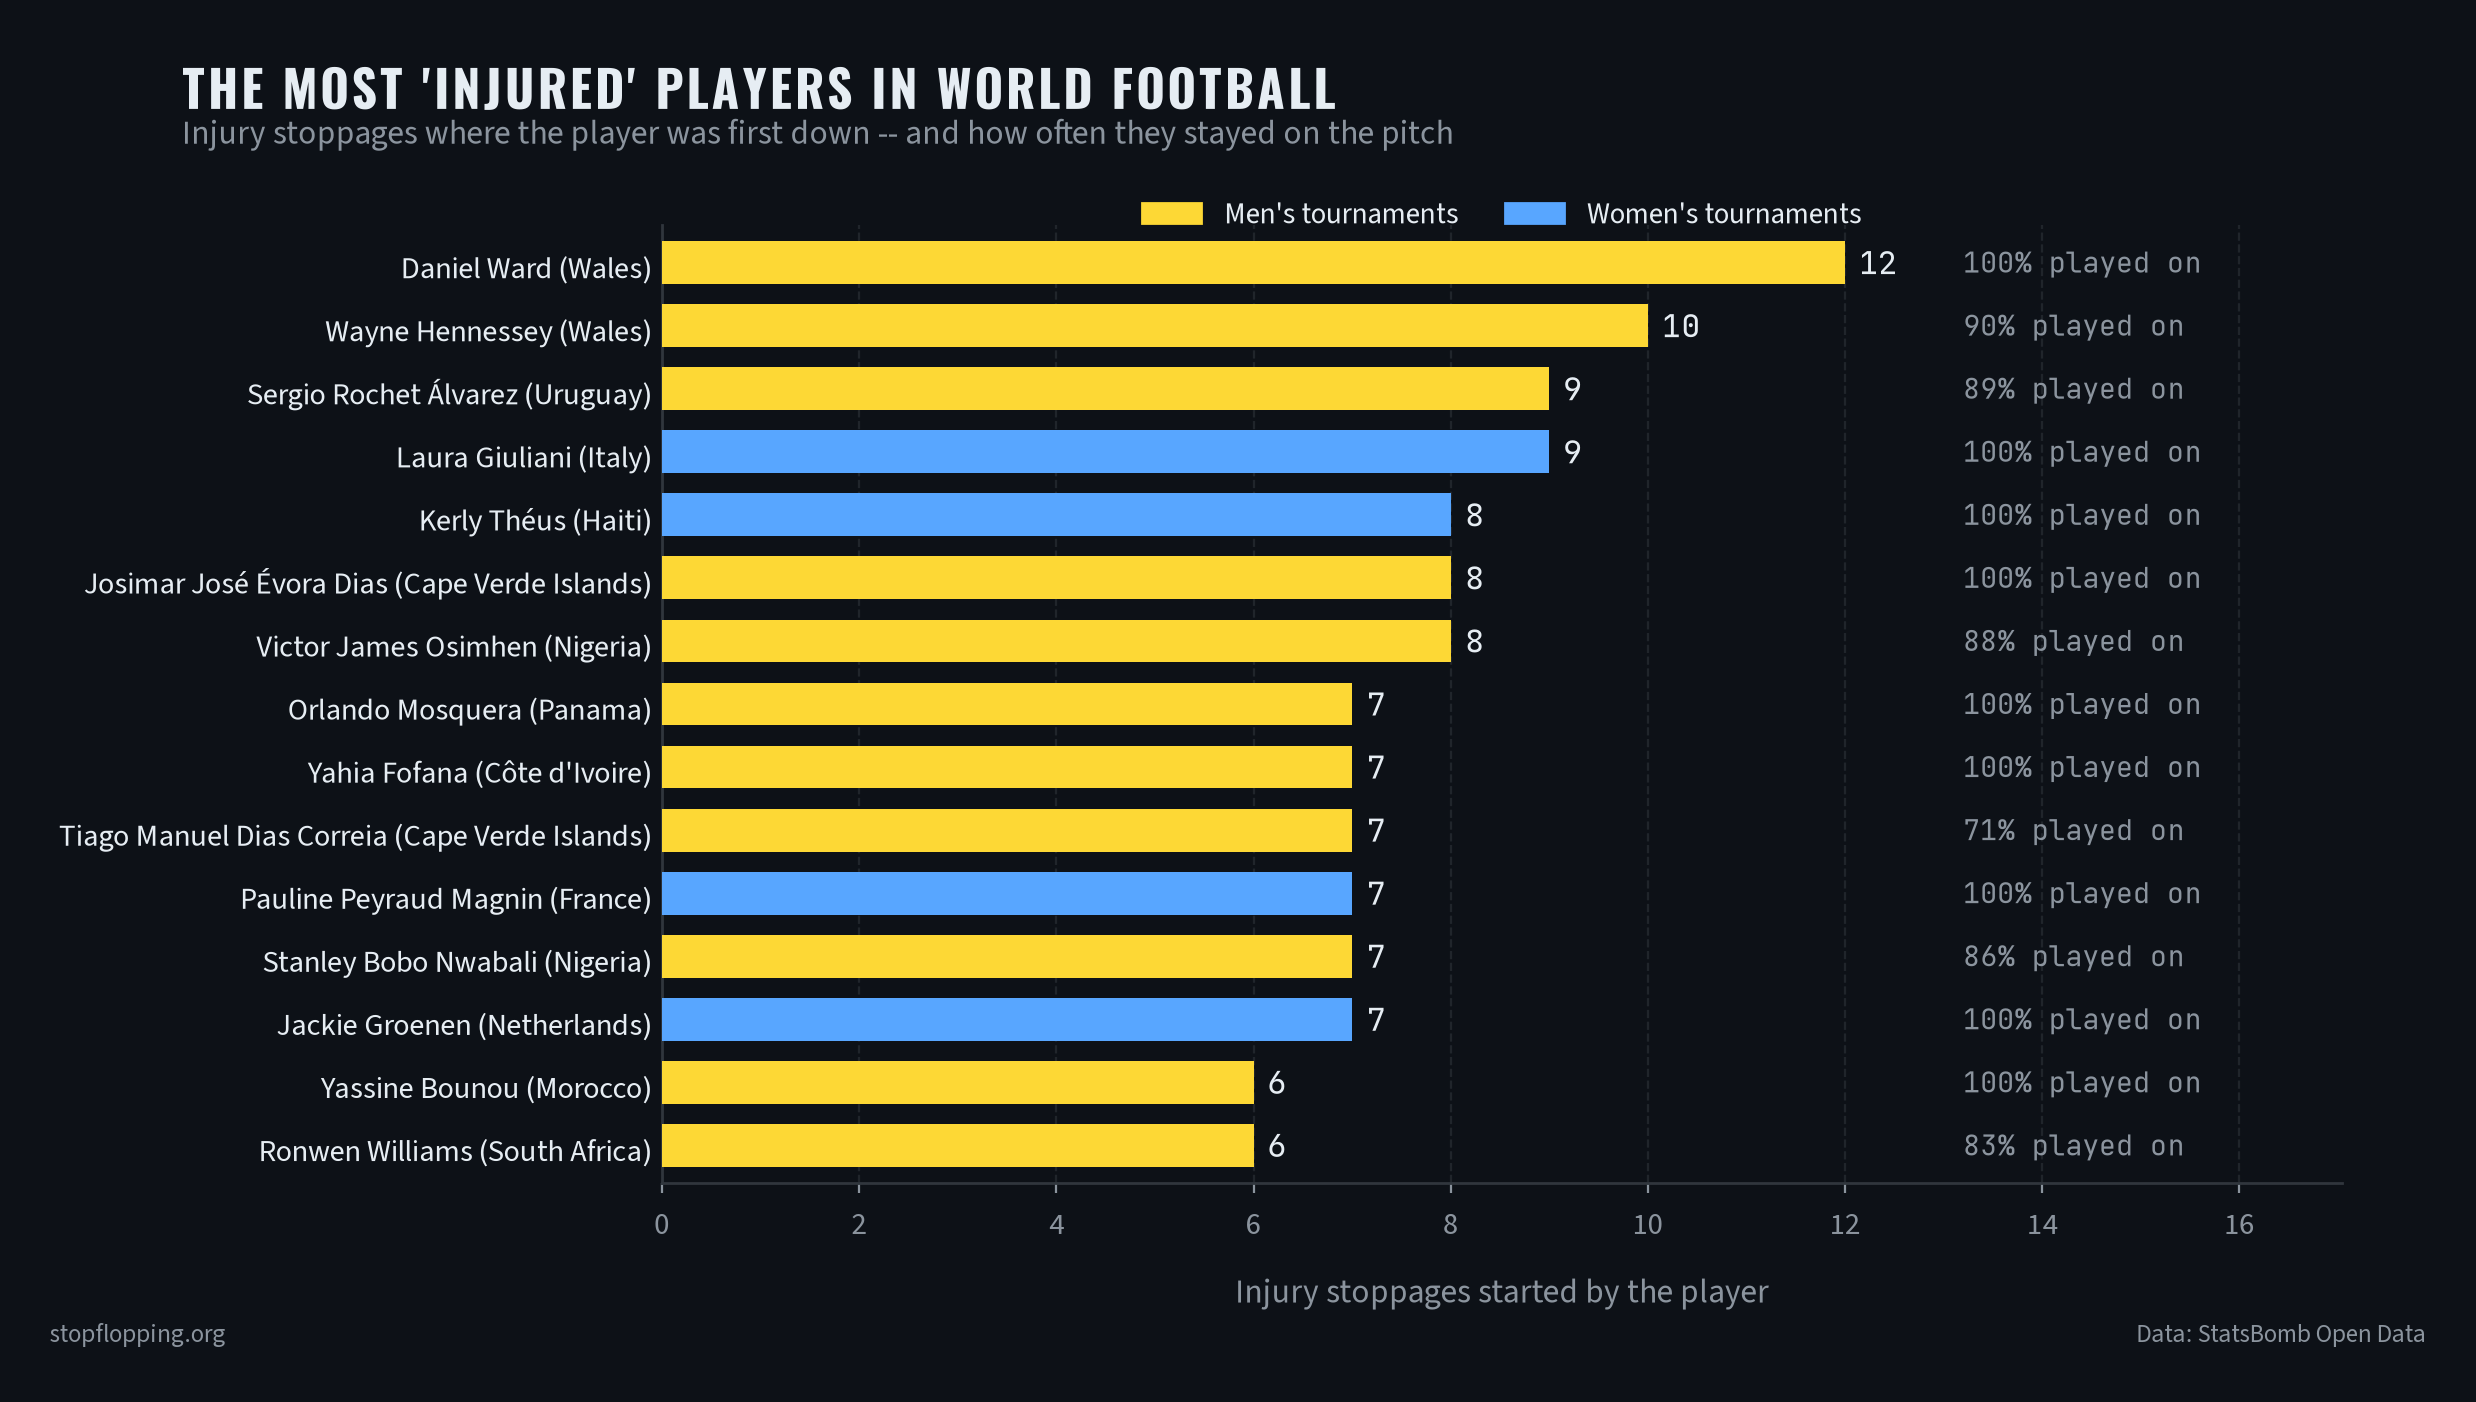
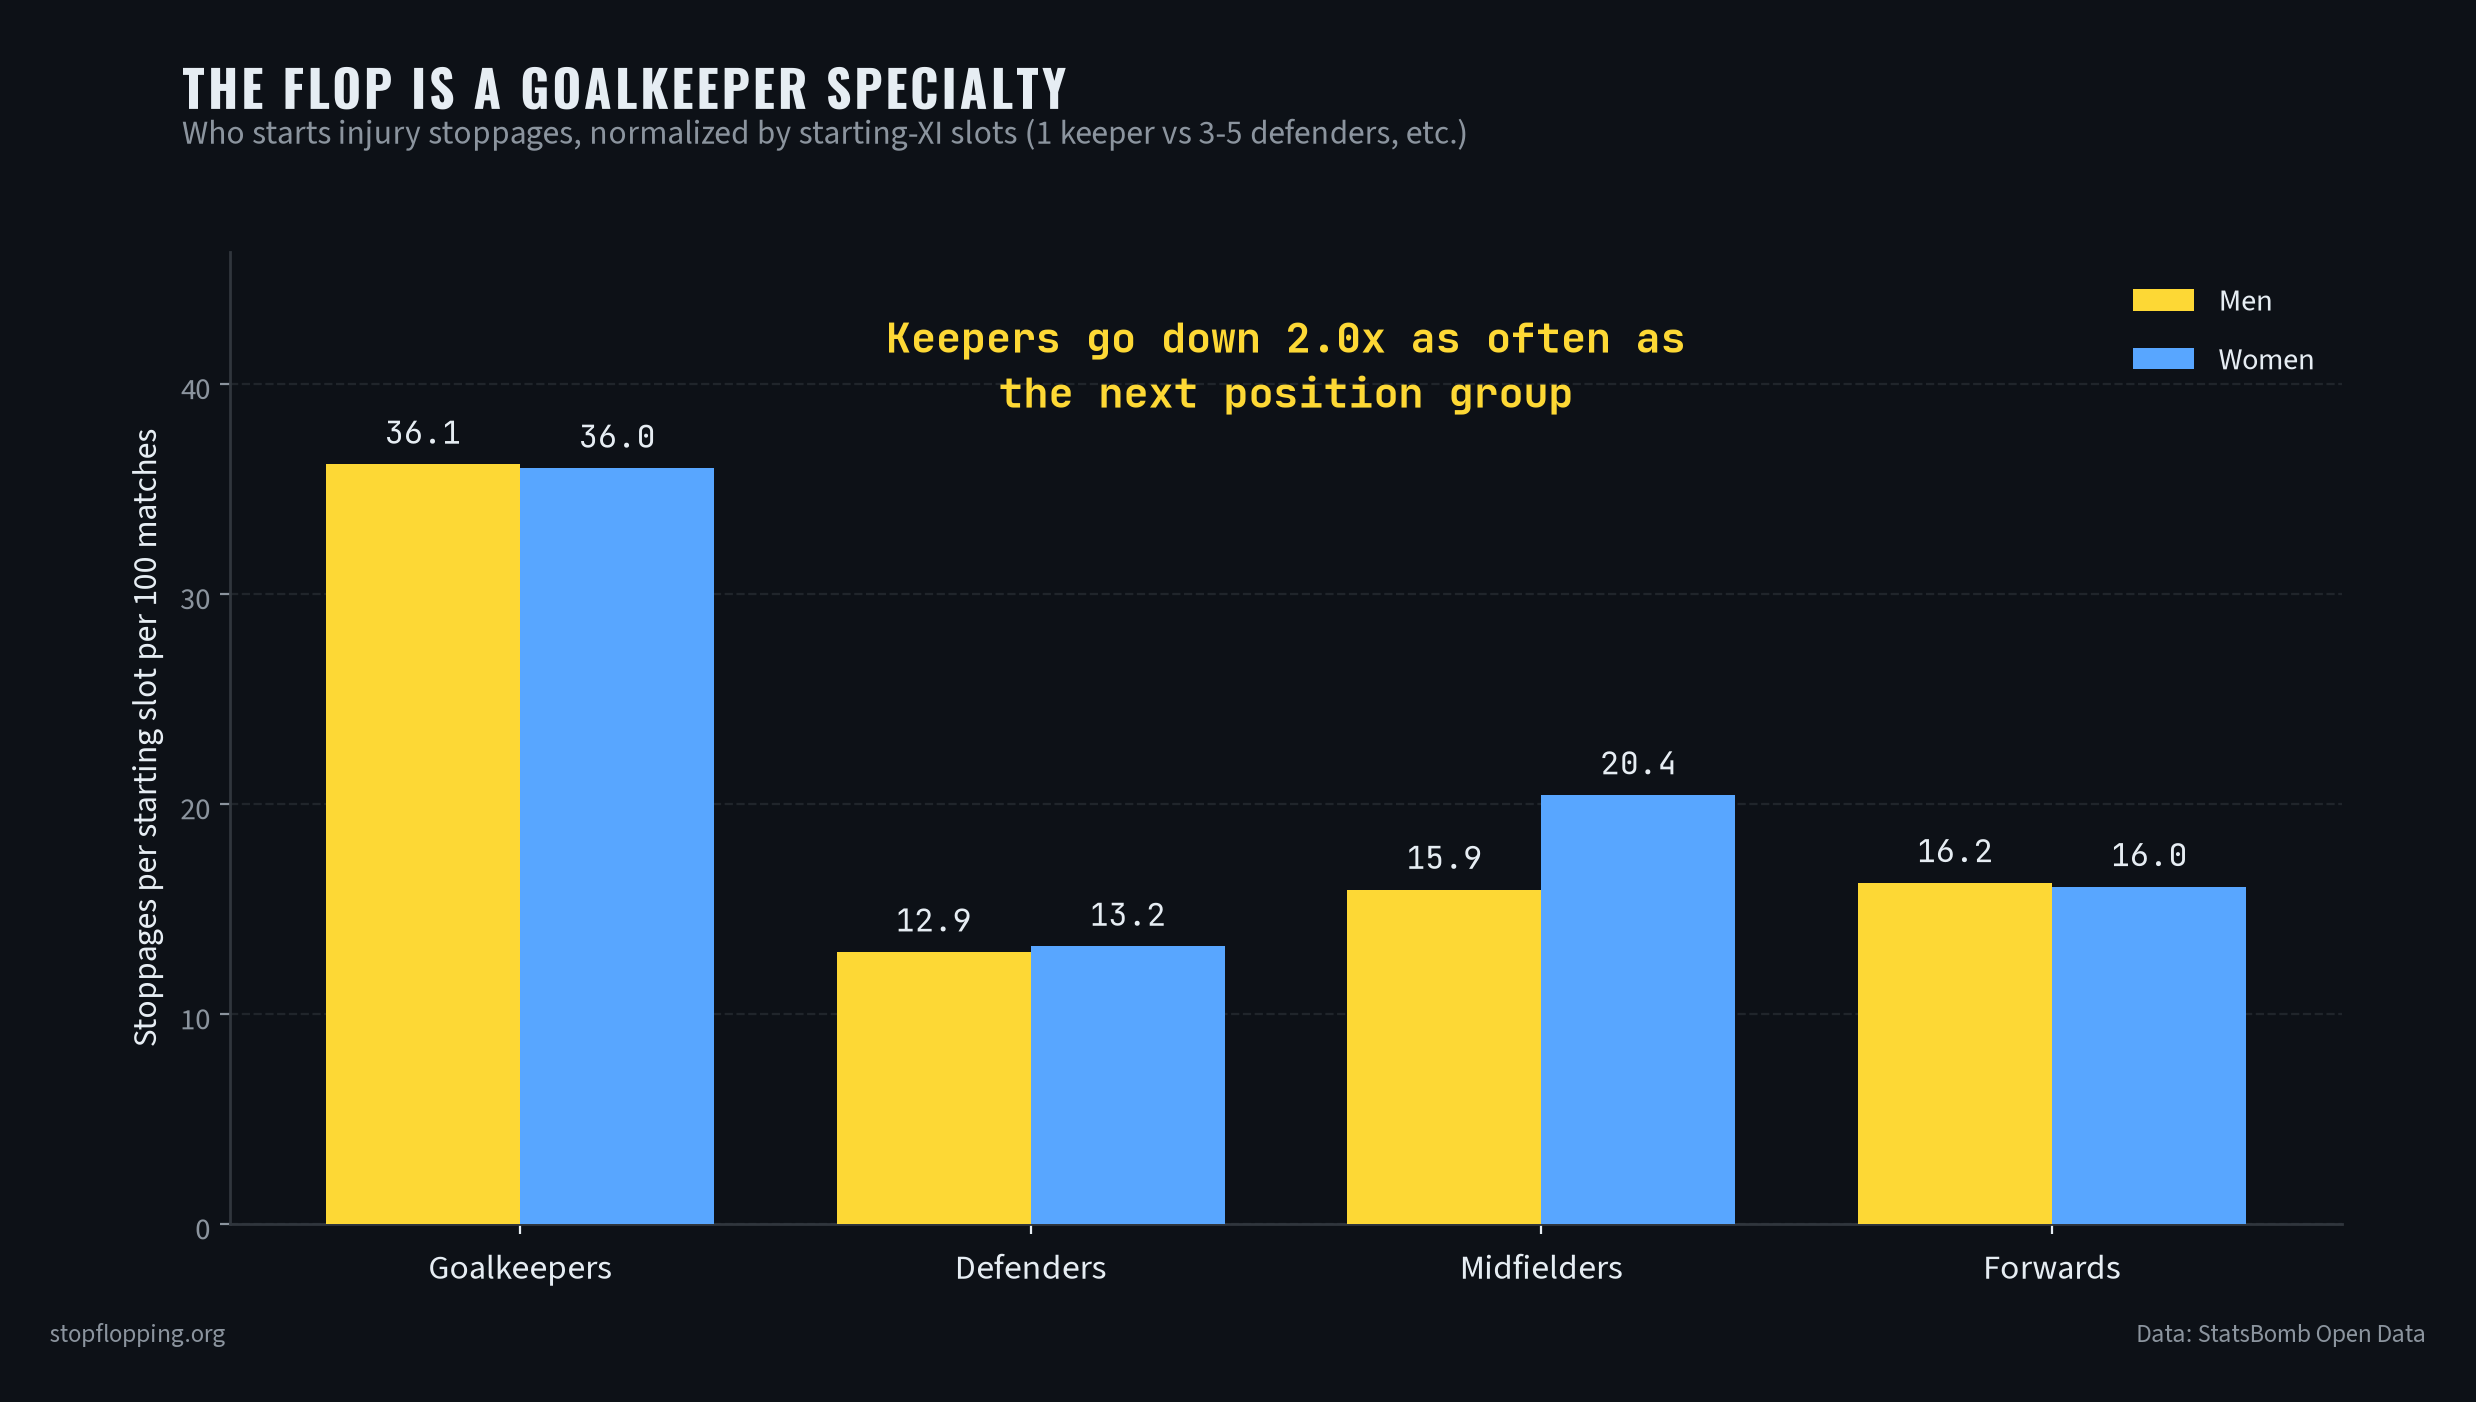
Source: original Stop the Flop analysis of StatsBomb Open Data (492 matches, 47,000+ restart delays, 2,033 injury stoppages; nations ranked only with 45+ minutes of leading exposure and 10+ matches). Charts free to reuse with credit: nations · the slowdown · players · positions. Data © StatsBomb.
The Rosenbaum studies used a hard behavioral test: an apparent injury counted as "definite" only if the player left the match within five minutes or showed visible bleeding. Everything else was "questionable." The categories validate themselves in the data — definite injuries were statistically associated with stretchers and on-field treatment, while questionable ones were associated with fouls, yellow cards, and match situation. Real pain and useful pain leave different fingerprints.
Rosenbaum et al. counted 5.63 apparent injuries per team per match in international men's football — only 0.41 (about 7.2%) were definite. A 2022 study of 266 matches in a top professional league found about 3.4 injury stoppages per match, averaging 88.7 seconds each, and only 17.4% of the treated players actually left the match. The overwhelming majority of on-pitch agony resolves itself the moment play is ready to resume.
No — about half as much. Measured the same way (apparent injuries per game, both teams combined), men's international matches produced 11.26 apparent injuries per game versus 5.74 in the women's game. Women's apparent injuries were also nearly twice as likely to be genuine: 13.7% definite versus 7.2% for men.
There's no evidence it does. Rosenbaum found no link between questionable injuries and winning or advancing from the group stage. Individual dives do extract free kicks — referees rewarded roughly a third of them in the David et al. sample — but teams that faked frequently didn't win more often. All that shame for zero measurable return.
Essentially never in real time. Across the 60 professional matches in David et al., referees rewarded about 33% of the 169 dives and punished zero. Renden et al. explains why: even elite referees only distinguish a foul from a dive correctly about 72% of the time. The dive is designed to beat human perception at full speed — which is exactly why the fix has to involve video review.